Graph Log Out | Topics | Search
Moderators | Register | Edit Profile

Latent Print Examination » General Questions from Non-Fingerprint Experts » Graph « Previous Next »

Author Message
Top of pagePrevious messageNext messageBottom of page Link to this message

Webmaster
Posted on Sunday, January 13, 2002 - 01:49 pm:   Edit Post Delete Post View Post/Check IP Print Post    Move Post (Moderator/Admin Only) Ban Poster IP (Moderator/Admin only)

From John Vanderkolk's excellent editorial submission, "Forensic Individualization of Images Using Quality and Quantity of Information", Journal of Forensic Identification
49 (3), 1999, page 253:
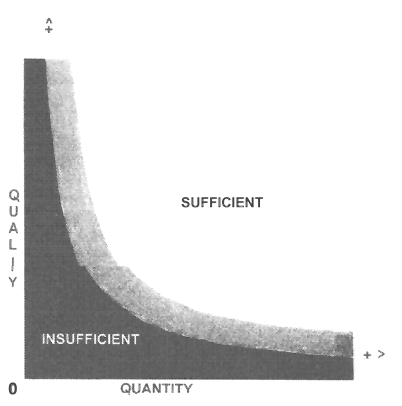


"If sufficient quality and quantity of information is present in the image, continue the comparison. If the quality and quantity of information is in the gray urea, continue the comparison process. Additional study of the image will take place during the comparison and evaluation of the images. If the quality and quantity of information is insufficient, the image is not suitable for a logical evaluation."
Top of pagePrevious messageNext messageBottom of page Link to this message

Caitlin
Posted on Friday, January 11, 2002 - 04:26 pm:   Edit Post Delete Post View Post/Check IP Print Post    Move Post (Moderator/Admin Only) Ban Poster IP (Moderator/Admin only)

how can I create a graph to show the clarity of latent prints from different surfaces?

Add Your Message Here
Post:
Username: Posting Information:
This is a public posting area. Enter your username and password if you have an account. Otherwise, enter your full name as your username and leave the password blank. Your e-mail address is optional.
Password:
E-mail:
Action: